Net Worth by Age: What's Normal, and Are You Behind?
By FINAIW Team · Reviewed by Nishit B, Founder, and Shilp G, Co-founder · Updated November 12, 2026 · 8 min read

Your friend just bought a flat. A cousin is posting from a beach in Bali. Someone at work mentions their portfolio "finally crossed six figures". And a quiet question starts to nag: am I behind?
Here's something that might help. In October 2026, the US Federal Reserve published its newest snapshot of household wealth. The typical family headed by someone under 35 had a net worth of $33,000, down 23% in three years. The typical household of any age had $215,900. And the "average" figures you see in headlines? They're four to six times higher than what a typical family actually has.
So before you compare yourself to anyone, let's look at the real numbers: what they mean, why most headlines get them wrong, and how to work out where you really stand.
What net worth actually means
Your net worth is one simple sum:
Net worth = everything you own − everything you owe
What you own includes cash, savings, investments, retirement accounts, the value of your home and anything else you could sell. What you owe includes your mortgage, car loan, education loan, credit card balances and personal loans.
It's not your salary. Someone earning a lot with big loans can have a lower net worth than someone earning half as much with no debt. You'll remember that from the janitor who died with $8 million.
Want your number in two minutes? Use the FINAIW Net Worth Calculator.
Net worth by age: the newest US data
These figures come from the Federal Reserve's 2025 Survey of Consumer Finances, released on 9 October 2026. It's the most detailed wealth survey in the world, run every three years. Figures are per family, in 2025 US dollars.
| Age of head of family | Median net worth | Average (mean) net worth | Average ÷ median |
|---|---|---|---|
| Under 35 | $33,000 | $135,400 | 4.1× |
| 35–44 | $155,600 | $681,900 | 4.4× |
| 45–54 | $253,700 | $1,244,500 | 4.9× |
| 55–64 | $411,900 | $1,878,000 | 4.6× |
| 65–74 | $431,300 | $1,897,600 | 4.4× |
| 75 and over | $504,900 | $1,962,200 | 3.9× |
| All families | $215,900 | $1,241,500 | 5.8× |
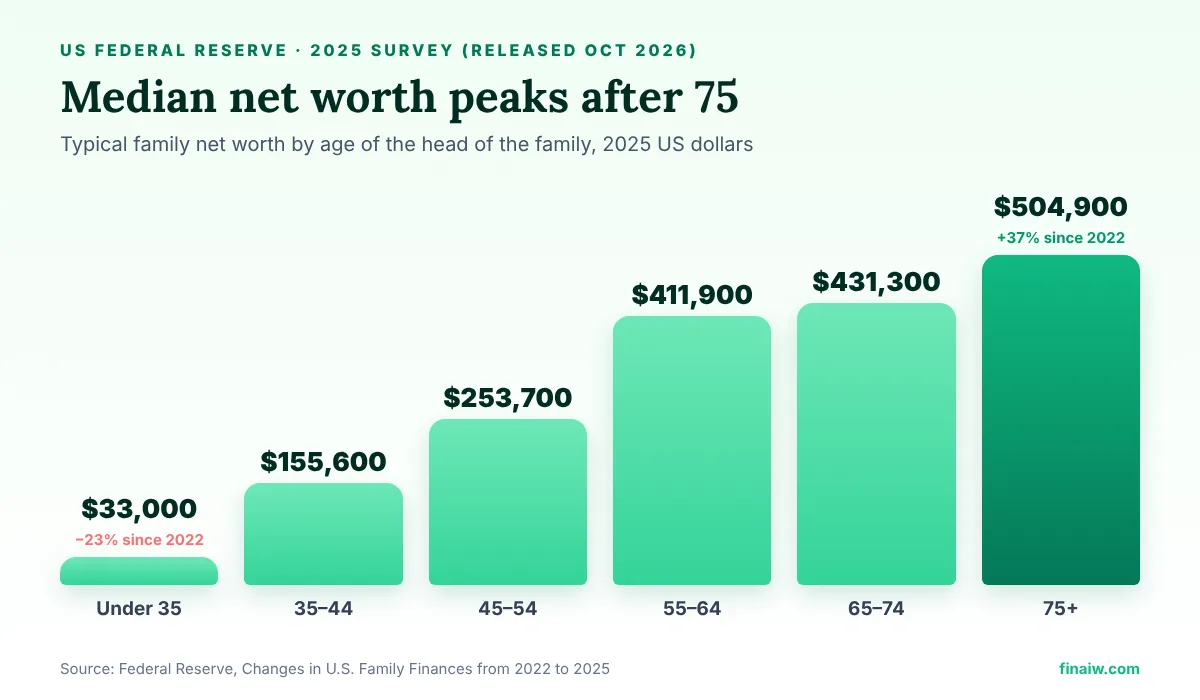
Three things jump out.
1. Wealth climbs with age, all the way to the end. Families aged 75 and over were the wealthiest group of all, with a median of $504,900. That group's median rose 37% in three years.
2. Young families went backwards. For families under 35, the median fell 23% and the average fell 33% between 2022 and 2025. The Fed says this was mainly the unwinding of business-equity gains young families had made between 2019 and 2022. If you're under 35 and feel like you're falling behind, the data says it's not just you.
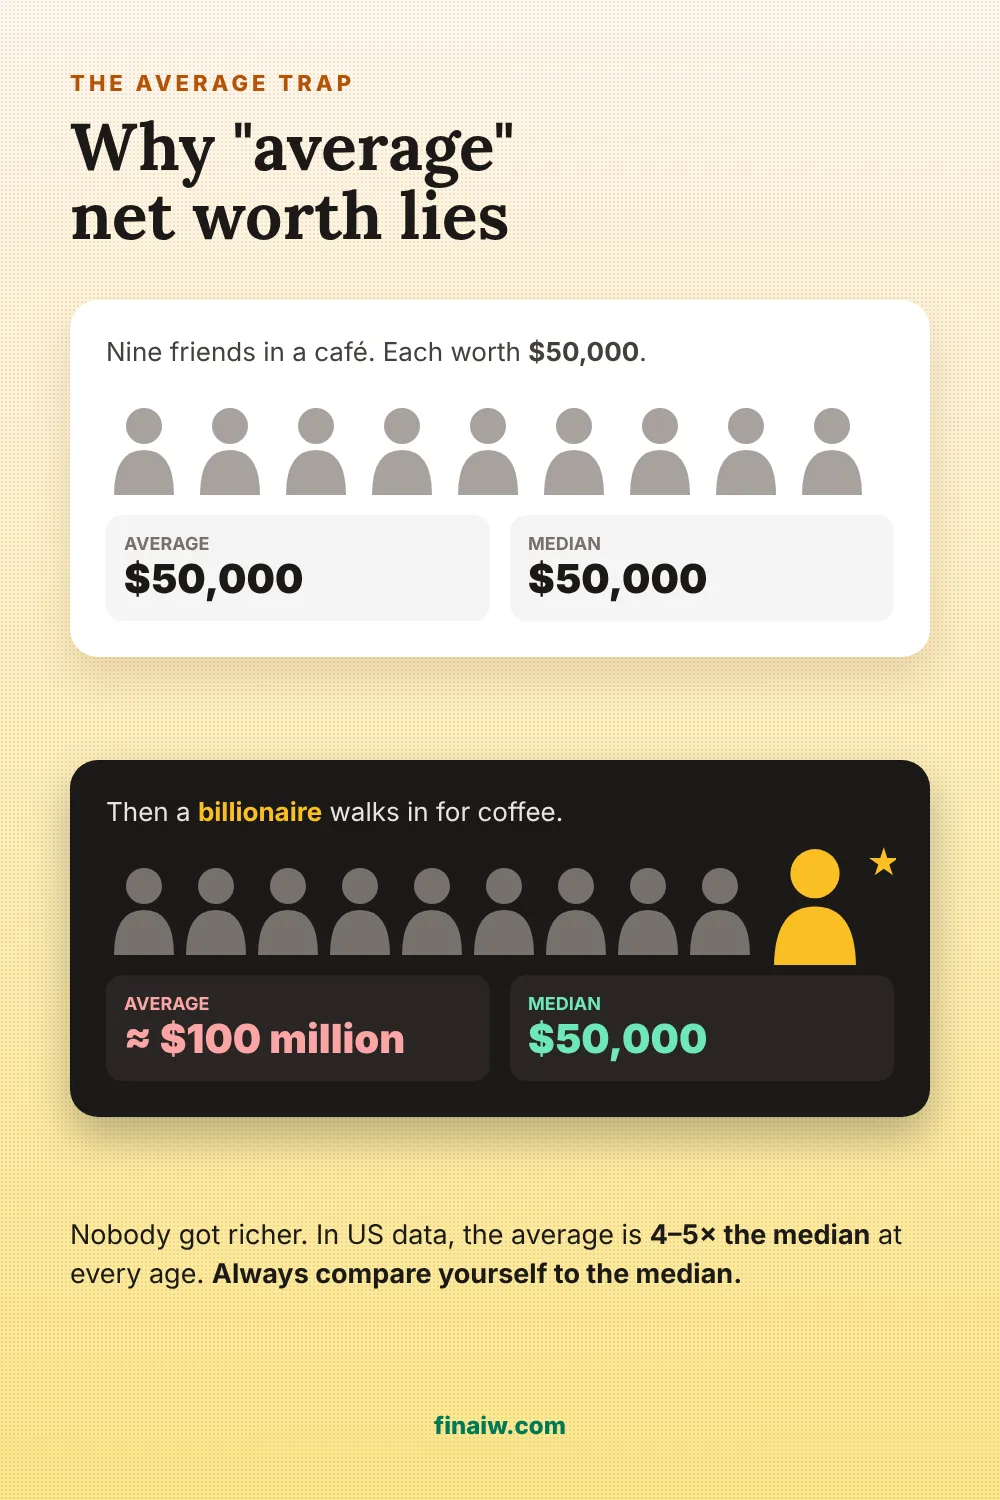
3. The "average" is a trap. In every age group the average is about four to five times the median. That's not a typo, and it's the most important number on this page.
Find your exact number in 30 seconds.
Add up what you own and what you owe — the FINAIW Net Worth Calculator works in any currency.
Open the Net Worth Calculator →Why the average lies to you
Imagine nine friends in a café, each with a net worth of $50,000. The average is $50,000. Then a billionaire walks in and orders a coffee. The average net worth in the room jumps to about $100 million.
Nobody in the café got a rupee richer. One person at the top dragged the average up.
That's exactly what happens in national wealth data. A small number of very wealthy households pull the average far above what a normal family has. The median, the family exactly in the middle, ignores the extremes. When a headline says "the average 40-year-old is worth $680,000", it's describing almost nobody.
Always compare yourself to the median.
Net worth by age outside the US
Wealth surveys differ by country, so these numbers aren't directly comparable with the US table. Still, they give you a sense of what "typical" looks like where you live.
United Kingdom. The Office for National Statistics (Wealth and Assets Survey, April 2018 to March 2020) found a median household wealth of £302,500. Households headed by 25 to 34-year-olds had a median of almost £77,000. For 35 to 44-year-olds it was nearly £200,000, and for those aged 55 to State Pension age, £553,400. UK figures include private pension wealth, which is a big reason they look high.
Around the world. UBS's Global Wealth Report 2026 (end-2025 data) gives median wealth per adult, not per household, in US dollars:
| Country | Median wealth per adult (USD) |
|---|---|
| Australia | 210,783 |
| Canada | 147,811 |
| Switzerland | 145,555 |
| United Kingdom | 125,335 |
| Singapore | 96,434 |
| United States | 68,998 |
| Germany | 53,485 |
Two surprises here. First, the US is one of the richest countries by average wealth but sits far lower by median: the average trap again, at national scale. Second, per-adult figures look smaller than household figures because a household usually contains more than one adult.
India. UBS no longer publishes a median for every country. The last full table (2023 edition, end-2022 data) put India's median wealth per adult at about $3,755, and the world median at about $8,654. These are older figures, but they make one point clearly: if you have any positive net worth and some savings invested, you're already ahead of a large share of the world.
Curious exactly where you rank? The FINAIW Global Net Worth Percentile tool shows your position against adults worldwide.
So, are you behind?
Probably not as much as you think, and here's an honest way to check.
Compare with the median for your age, not the average. If you're 38 with a net worth of $90,000, you're below the US median for your age group ($155,600). That's useful information, not a verdict. If you were at $40,000 three years ago, you're moving fast in the right direction, and that's the comparison that matters most.
Look at the direction, not the snapshot. A 30-year-old with a large education loan can have a negative net worth and still be doing everything right. Net worth early in life is mostly about the trend: is the number rising every year?
Use a savings-based target alongside it. Fidelity's widely quoted guideline is to aim for about 1× your salary saved for retirement by 30, 3× by 40, 6× by 50, 8× by 60 and 10× by 67. For a target built on your expenses instead, see how much to save for retirement by age.
How to grow your net worth, at any age
There's no secret. There are only a few levers, and you control all of them.
- Pay off expensive debt first. Clearing a credit card at 36% interest is a guaranteed 36% return. No investment beats that.
- Invest automatically every month. Even small amounts compound. Investing a fixed amount monthly is how most ordinary people reach seven figures.
- Raise your savings rate with every pay rise. Upgrade your future before you upgrade your lifestyle.
- Build an emergency fund. It stops one bad month from turning into new debt. Use the Emergency Fund Calculator to size yours.
- Track your net worth once or twice a year. Not daily, not weekly. You're watching a long-term trend, not a stock ticker.
Frequently asked questions
What is the average net worth by age in 2026?
The newest US data (Federal Reserve, 2025 survey, released October 2026) puts median family net worth at $33,000 for under-35s, $155,600 for 35 to 44, $253,700 for 45 to 54, $411,900 for 55 to 64, $431,300 for 65 to 74 and $504,900 for 75 and over. Averages are four to five times higher because a few very wealthy families pull them up.
What is a good net worth at 30?
In the US, the median for families under 35 is $33,000. A positive and rising net worth at 30 is a good sign. Fidelity suggests aiming for about one year's salary saved for retirement by 30.
What is a good net worth at 40?
The US median for families aged 35 to 44 is $155,600. Fidelity's guideline is about three times your annual salary saved for retirement by 40.
Should I compare myself to the average or the median?
The median. The average is pulled up by a small number of very wealthy households, so it's four to five times higher than what a typical family has.
How do I calculate my net worth?
Add up everything you own (cash, investments, retirement accounts, property) and subtract everything you owe (mortgage, loans, credit cards). The FINAIW Net Worth Calculator does it for you.
The bottom line
Net worth by age is a useful mirror, as long as you look into the right one. Ignore the averages, compare yourself to the median, and above all compare yourself with you, last year. If that number keeps rising, you're on the right path, whatever your cousin's holiday photos say.
Find your number with the FINAIW Net Worth Calculator →, then see where you rank globally →.
Sources: Federal Reserve, "Changes in U.S. Family Finances from 2022 to 2025" (October 2026); Office for National Statistics, Total wealth in Great Britain, April 2018 to March 2020; UBS Global Wealth Report 2026 and 2023; Fidelity, "How much do I need to retire?"
Disclaimer: This article is for education only and is not financial advice. Survey figures describe groups, not individuals, and differ by country and method. Please speak to a licensed adviser in your country for personal advice.
Find your exact number in 30 seconds.
Add up what you own and what you owe — the FINAIW Net Worth Calculator works in any currency.
Open the Net Worth Calculator →